Every price movement in the forex market tells a story — and candlestick patterns are the language it speaks. Before charts, before indicators, before algorithms, traders learned to read the raw battle between buyers and sellers through the shape of a single candle.
If you’re just starting out in forex, you don’t need to memorize a hundred patterns. You need to deeply understand a handful that actually work — patterns that appear on EUR/USD, GBP/USD, and USD/JPY charts every single week.
“Price action is the purest form of market analysis. Candlestick patterns are its alphabet.”
In this guide, we’ll walk through five essential candlestick patterns with clear explanations, visual chart diagrams, and actionable trading context so you can start recognizing them in real-time.
Table of contents
The Doji — The Market’s Moment of Indecision
Neutral / Reversal Warning
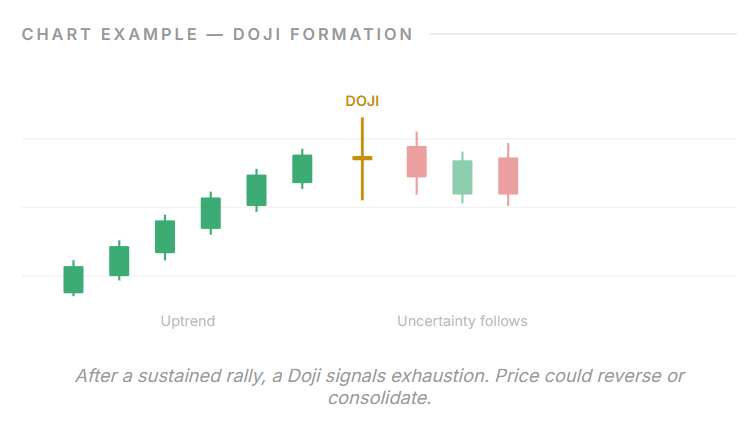
A Doji forms when a currency pair’s opening and closing prices are virtually identical, leaving behind a cross or plus-sign shape. The long wicks on either side show that price moved significantly in both directions during the session — yet ultimately settled where it began.
In the forex market, a Doji on a higher timeframe (like the Daily or H4 chart) is a powerful signal that the current trend may be losing steam. Neither bulls nor bears could claim victory. When this appears after a prolonged uptrend or downtrend, pay close attention — a reversal could be forming.
Pro Tip: A Doji alone is not a trading signal. Always wait for the next candle to confirm direction. A bearish candle following a Doji at resistance is a strong sell setup.
The Hammer — A Reversal from the Bottom
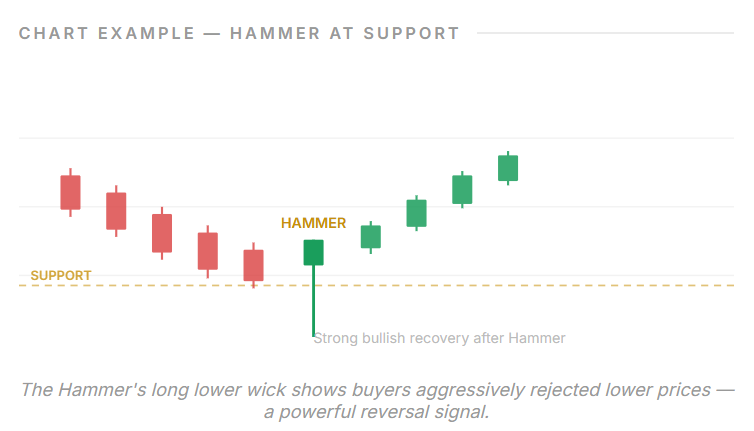
The Hammer is one of the most recognizable and reliable single-candle reversal patterns. It appears at the bottom of a downtrend and features a small real body at the top with a long lower wick — at least twice the size of the body — and little to no upper wick.
The psychology behind this shape is compelling: sellers pushed price sharply lower during the session, but buyers flooded in and drove it back up near the open, suggesting strong support at that level. The market “hammered out” a bottom.
In forex, look for Hammers forming at key support levels, Fibonacci retracement zones, or round number prices (e.g., 1.1000 on EUR/USD) for the highest probability setups.
Pro Tip: The color of the Hammer’s body matters less than the wick. A green (bullish) body is slightly more reliable than a red one, but both are valid signals when appearing at clear support.
The Engulfing Pattern — When One Side Takes Control
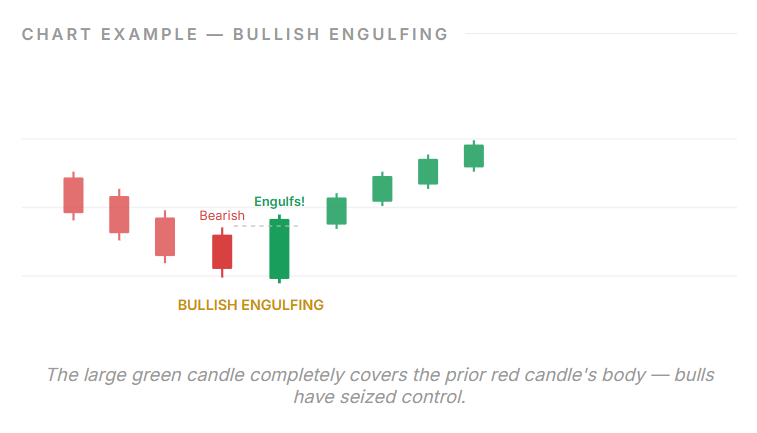
The Engulfing Pattern is a two-candle formation and one of the most powerful reversal signals in forex. A Bullish Engulfing occurs when a large green candle completely swallows the previous red candle — indicating bulls have overwhelmed bears. A Bearish Engulfing is the opposite.
What makes this pattern so meaningful is the sheer force it represents. In a single session, the momentum of the prior candle is not just reversed — it’s completely overrun. Institutional traders and algorithmic systems alike react to this signal, making it self-reinforcing.
The larger the second candle relative to the first, the stronger the signal. Look for Engulfing patterns forming at the end of extended trends, near key support/resistance levels, or following a period of consolidation.
Pro Tip: Volume confirmation supercharges this pattern. If the engulfing candle forms on noticeably higher volume than the previous candle, the signal becomes significantly more reliable.
The Morning Star — Three Candles, One Powerful Signal
The Morning Star is a three-candle pattern that signals the end of a downtrend. It consists of: a large bearish candle, followed by a small-bodied candle (the “star”) that gaps lower, and finally a large bullish candle that closes well into the first candle’s body.
In forex, true gaps are rare due to 24-hour trading, but the pattern is still valid when the middle candle is clearly smaller than its neighbors. The star represents a transitional moment — sellers lost conviction, and buyers began stepping in tentatively. The third candle is the confirmation: bulls have arrived in force.
The Morning Star is particularly reliable when it forms after an extended downtrend, near a significant support zone, or at the end of a corrective wave in an overall bullish market.
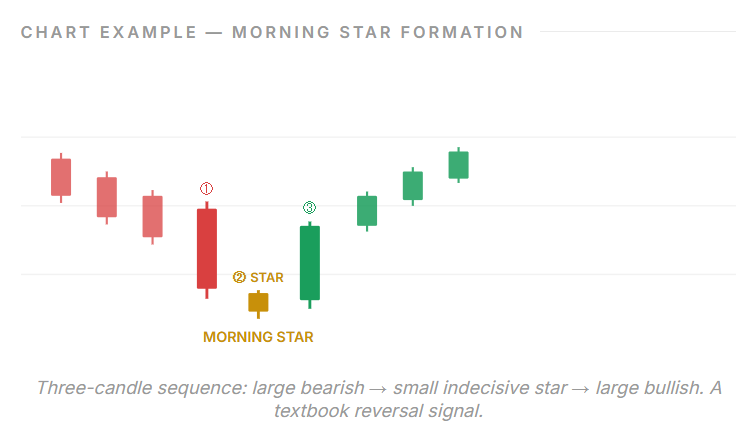
Pro Tip: The deeper the third candle penetrates into the first candle’s body, the stronger the reversal signal. Ideally, it should close above the midpoint of the first candle.
The Shooting Star — Rejection at the Top
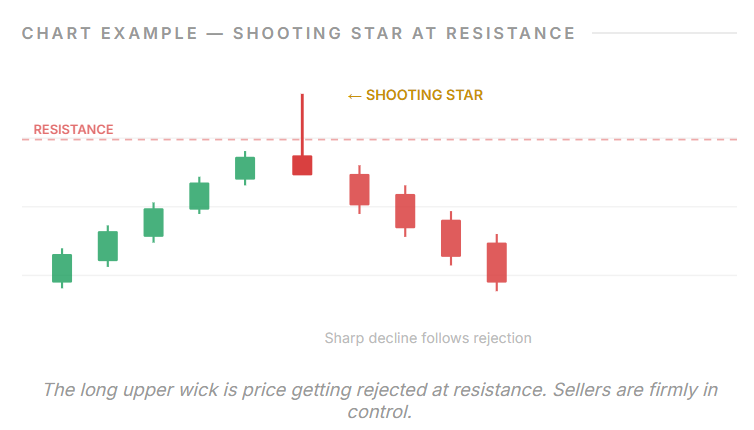
The Shooting Star is the bearish mirror image of the Hammer. It features a small body at the bottom of the candle and a long upper wick — at least twice the size of the body — with little to no lower wick. It appears at the top of an uptrend.
The narrative: bulls pushed price sharply higher during the session, but sellers overwhelmed them and forced price back down near the open. The long upper wick is a scar of failed buying pressure — a rejection of higher prices. When this forms at a key resistance level, it’s a high-confidence sell signal.
In the forex market, Shooting Stars are especially powerful on the EUR/USD and GBP/USD when they form near round numbers, previous highs, or the upper boundary of a trading range.
Pro Tip: Don’t confuse a Shooting Star with an Inverted Hammer. They look identical — the difference is context. A Shooting Star appears after an uptrend (bearish signal). An Inverted Hammer appears after a downtrend (potentially bullish).
Putting It All Together
Candlestick patterns are not magic — they are probability-based tools that reflect the collective psychology of market participants. No single pattern guarantees a profitable trade. What they do is shift the odds in your favor when used in the right context.
Here’s a quick reference summary of everything we covered:
| Pattern | Signal | Best Used At |
| Doji | Indecision | Trend extremes, key levels |
| Hammer | Bullish Reversal | Support zones, downtrend bottoms |
| Engulfing | Strong Reversal | Trend endings, S/R levels |
| Morning Star | Major Reversal | Daily chart, key support |
| Shooting Star | Bearish Reversal | Resistance zones, uptrend tops |
The best traders combine these patterns with broader context: trend direction, key support/resistance, volume, and risk management. Start by spotting these patterns on demo charts before trading real money, and always use a stop-loss.
Mastering these five patterns is a genuine foundation. You’ll see them play out week after week on every major forex pair — and each time you recognize one in context, your edge grows sharper.
This content is provided for informational and educational purposes only and does not constitute financial, investment, or trading advice. Forex trading involves significant risk and may not be suitable for all investors. You should carefully consider your financial situation and risk tolerance before participating in the foreign exchange market. Past performance is not indicative of future results.